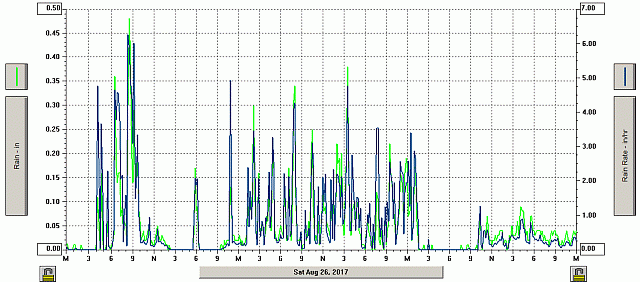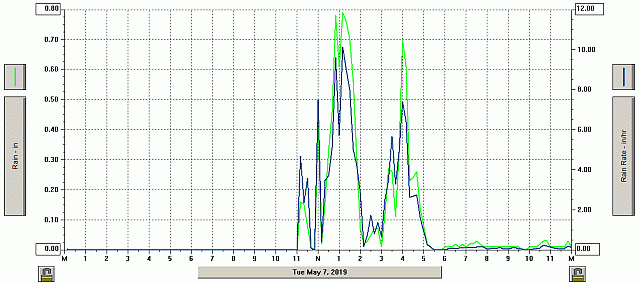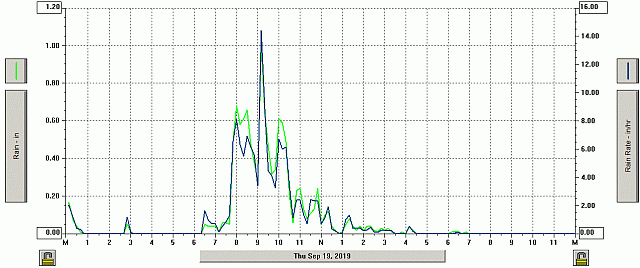


These charts illustrate the rain rates and rainfall recorded for Hurricane (tropical storm) Harvey, Tropical storm Imelda, and street flooding events. Storm drains are apparently designed to deal with two inches per hour rainfall. Rainfall is the amount of rain recorded during ten minutes. Rain rate is calculated from the rate at which the 0.01" bucket empties on the rain gauge. I need to correlate rate and rainfall with water level in the street.
The street flooded during Harvey but drained multiple times. We received 20.11" total and the water rose well up the drive but not to the slab. During the May 7, 2019 event we received 5.9" in 2 hours and 10.46" total. Water level got close to the house. During Imelda we received 8.8" in 3 hours and 11.64" total. Water level got within a few inches of the top of the slab.


